Overview Dashboard
The Overview dashboard displays the overall security status of the Splunk environment, in addition to highlighting present security issues as well. We specifically designed the Overview dashboard to be a single pane of glass for ease of use.
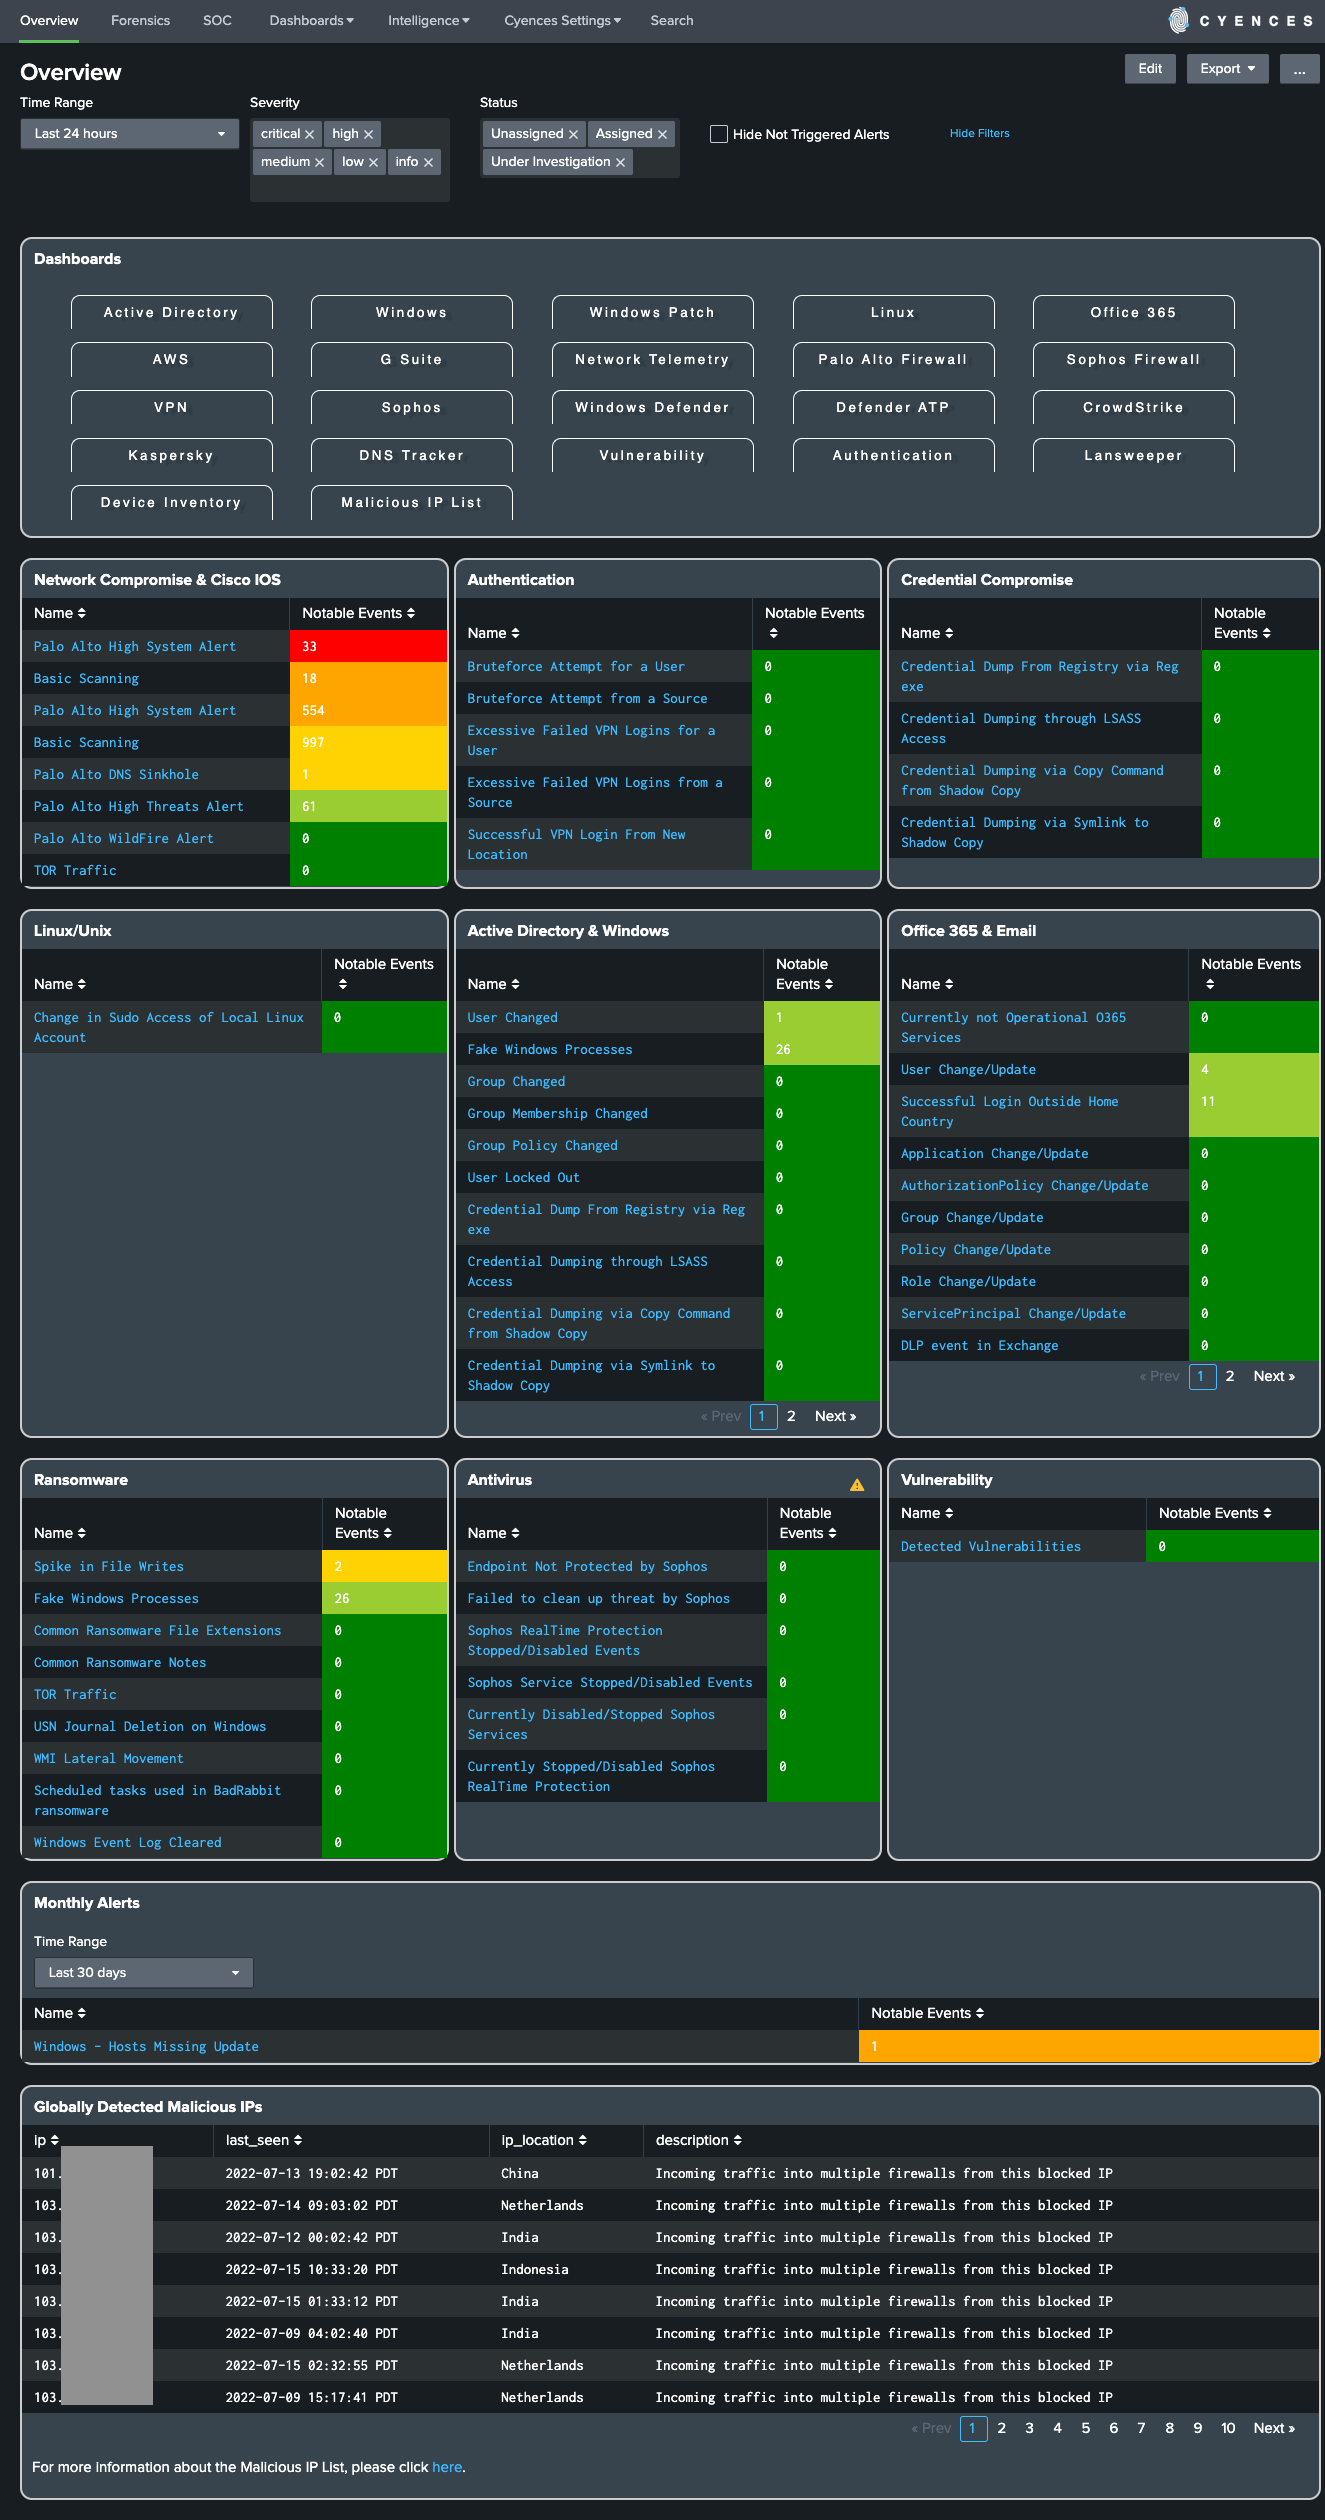
Overview Dashboard Features:
Alerts
- Each alert is inspired by common security use cases to detect problems in your environment (i.e., Sophos - Endpoint Protection Service is not Running is an alert that identifies when a Sophos antivirus service stops running on an endpoint).
- All of the dashboard panels in the Overview dashboard display the status for each alert in the selected time-range.
- All of the alerts are distributed in a categorized fashion, so some alerts may fall into multiple categories (i.e., Fake Windows Processes alert is present in both Ransomware and Windows). This allows for a more thorough breakdown for any Splunk environment and can easily assist with all sorts of security vulnerabilities that may appear.
- If the Notable Events count is greater than zero and changes from green to another color, then that indicates a security violation for the specified alert. Notable events are the number of security issues that the Cyences App has detected via Splunk events (logs). The severity of a security violation for a notable event is highlighted in either: green, yellow, orange, or red (green = informational and low severity; yellow = medium severity; orange = high severity; red = critical severity). A multi-select filter for severity is present to allow Splunk users a more customizable view based on their security needs.
- Clicking on any row within a dashboard panel retrieves more information about the selected alert. By doing so, it will automatically redirect the Splunk user to the Forensics dashboard. Refer to the Forensics Dashboard section for more information.
- The Monthly Alerts section focuses on important aspects of your environment that are less active, but are still necessary to keep track of (i.e., newly detected vulnerabilities).
Note: After installing the Cyences App, the Overview dashboard will be empty by default. The Overview dashboard only displays enabled alerts and they each have to be manually enabled. Refer to the Enable Alerts and Reports section to find out how to enable alerts/reports within the Cyences App.