Forensics
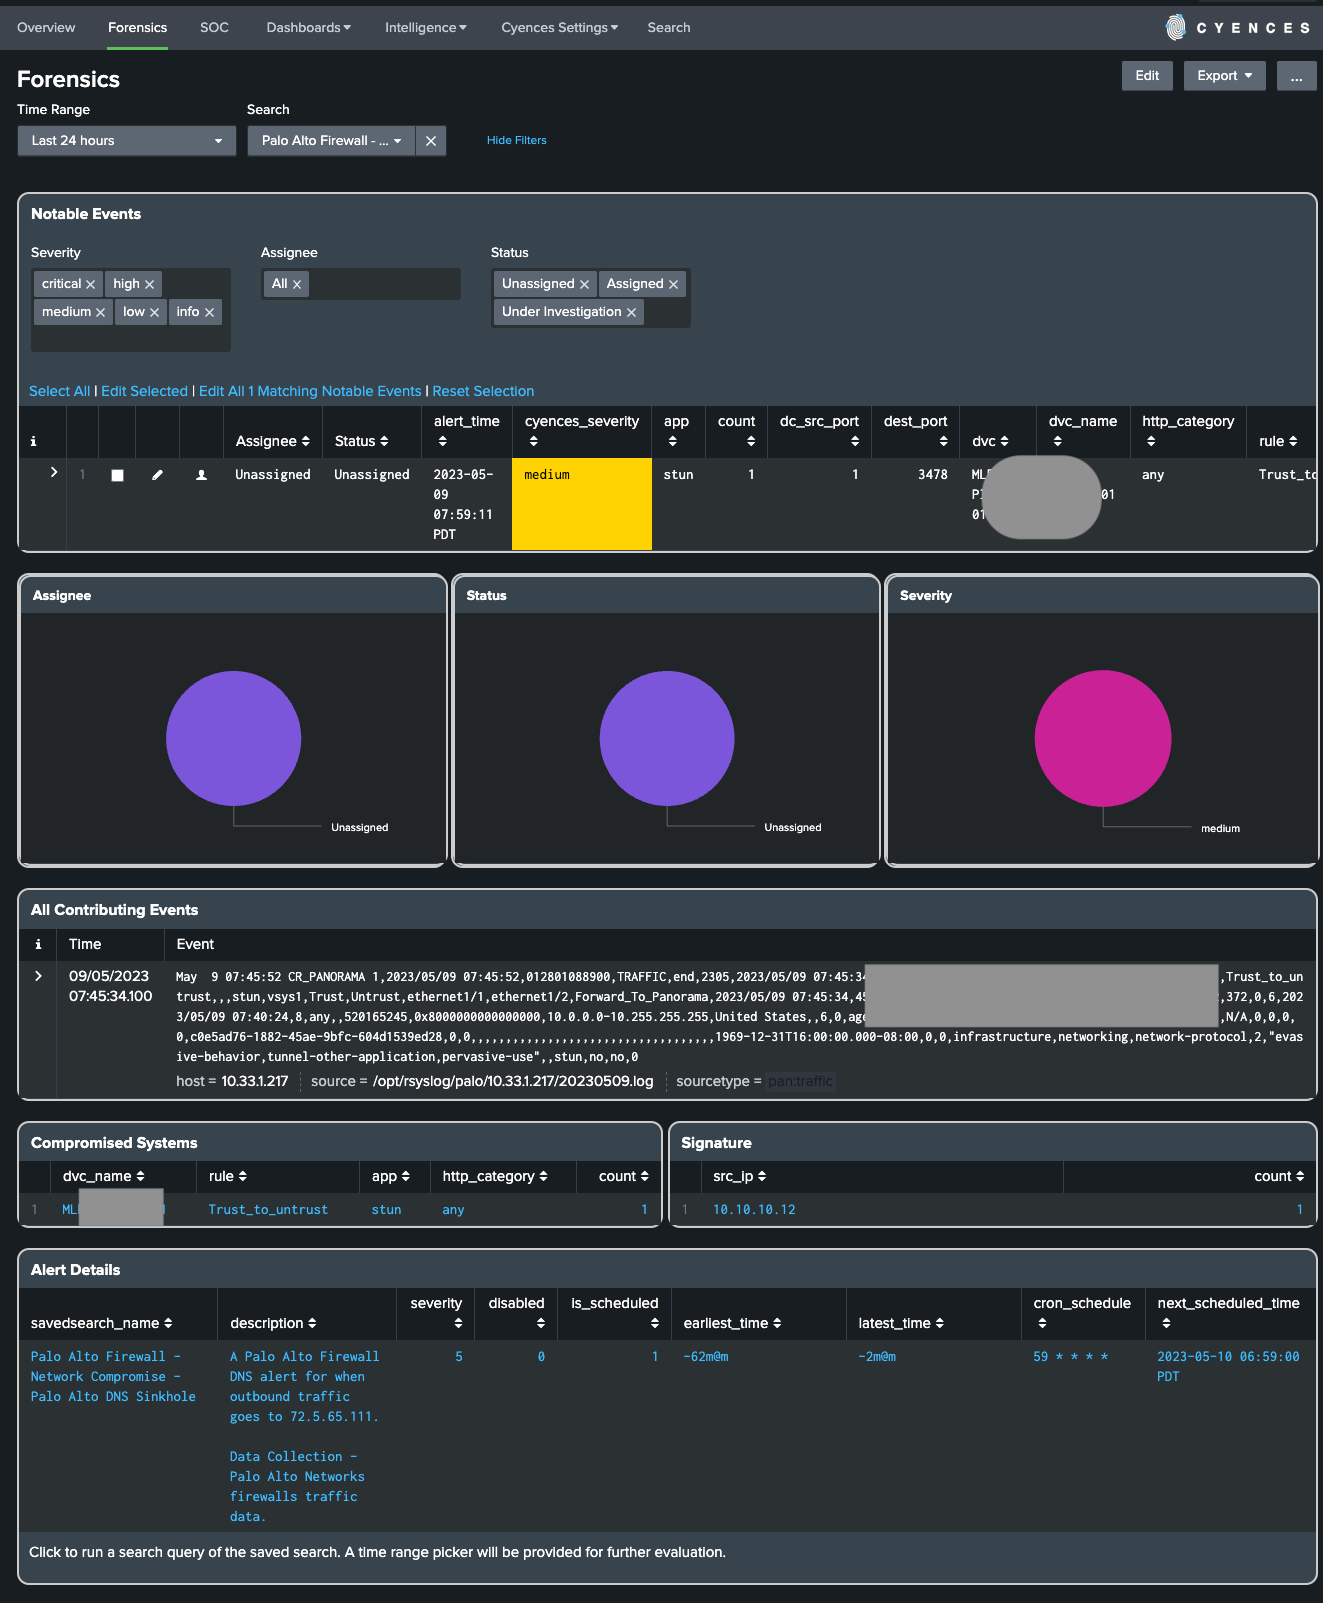
The Forensics dashboard is designed to give security engineers insightful information associated with their security investigation. This is mainly a drilldown dashboard from the Overview dashboard, but it is also useful for finding additional information about the various kinds of alerts Cyences has to offer and their matching descriptions. Select any alert from the dropdown and the Forensics dashboard will provide more information about the alert.
The dashboard also helps with completing a forensics dashboard regarding a security issue, as it shows pertinent information about the compromised systems and signatures involved in their respective panels. If a Splunk user drilldowns on either of these dashboard panels (Compromised Systems and Signature), it will provide additional details about which other events were involved or where a similar problem is present. A broader way to access these events is to drilldown from the Alert Details dashboard panel to view the activity that was responsible for triggering the alert.
Forensics Dashboard Features:
Notable Events
- The events displayed within this section highlight events that are linked to the selected alert.
- They help determine what the problem is and where the problem has occurred.
- It contains valuable information that provides more insight about the matter such as: destination, file extensions, file names, file paths, IP addresses, sourcetypes, and much more.
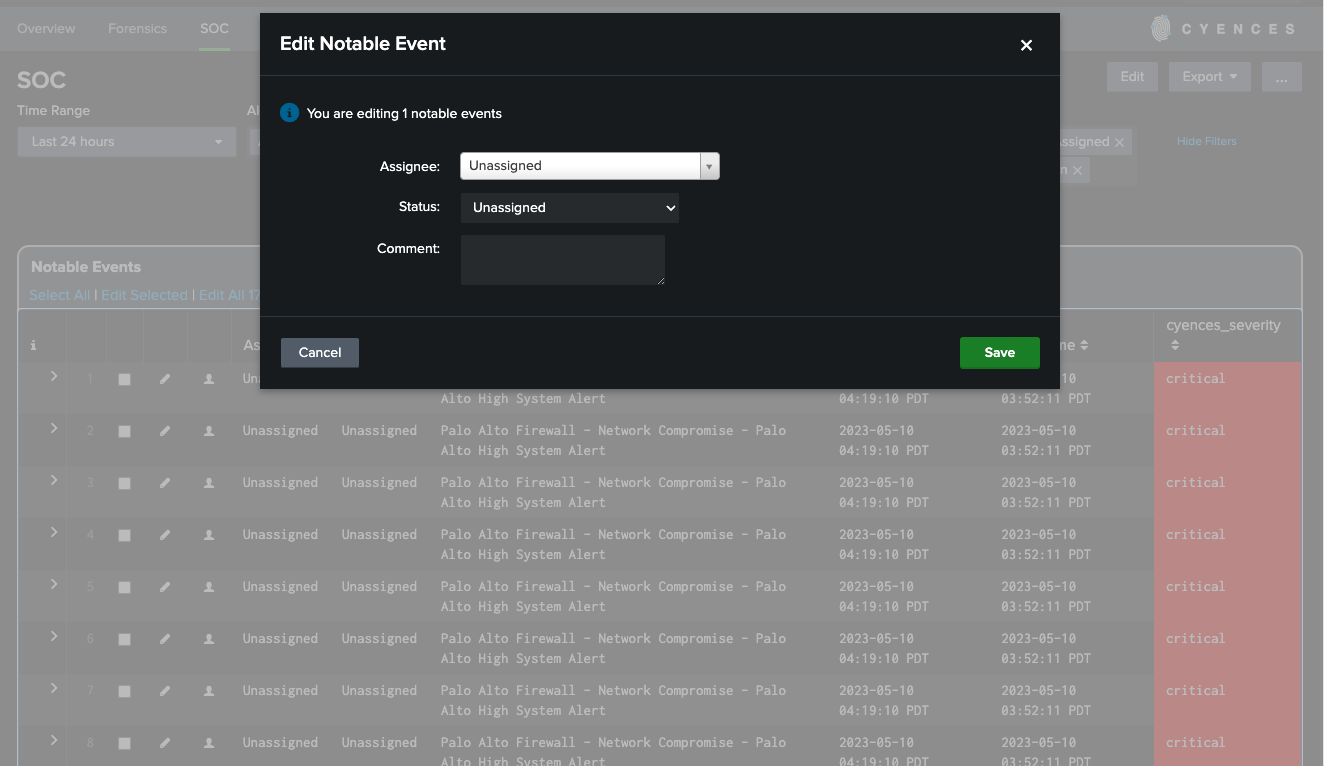
Notable Event Assignment and Status
- User can assign notable events to the user on Splunk for further investigation of the incident.
- User can also update the status of the notable event based on the investigation phase.
All Contributing Events
- This dashboard panel displays events that are responsible for generating notable events/alerts or in some cases events related to the generated notable events/alerts.
Compromised Systems
- This section outlines which systems the issue was detected on and includes relevant information like which hosts or sourcetypes have been affected.
- The count column informs Splunk users as to how many notable events are tied to the compromised system(s).
- Splunk users can also drilldown to see relevant _raw events on the search page.
Signature
- The signature details who or what could be causing the security concern and which file names, user or source IP addresses, etc are involved in the matter.
- The count column informs Splunk users as to how many notable events are tied to the this signature(s).
- Splunk users can also drilldown to see relevant _raw events on the search page.
Alert Details
- Describes what the purpose of the alert is, the severity of the alert, and scheduling details.
- This dashboard panel is useful if you are new to the Cyences App and want more information about the security use case or alert.
- Users can drilldown from this dashboard panel to manually execute the search query of the alert.